หน้าแรกของ IC Markets เข้าสู่ระบบ เว็บเทรดเดอร์ ติดต่อเรา
IC Markets Social IC Markets Social

Information Hub for
Serious Traders

  • เกี่ยวกับเรา
  • เปิดบัญชีเทรด
  • เปิดบัญชีเดโม่
  • เริ่มเทรด
  • เยี่ยมชมบล็อกของเรา
IC Markets Social
  • เกี่ยวกับเรา
  • เปิดบัญชีเทรด
  • เปิดบัญชีเดโม่
  • เริ่มเทรด
  • เยี่ยมชมบล็อกของเรา
October 19, 2022North_American_Stocks_enIC Markets

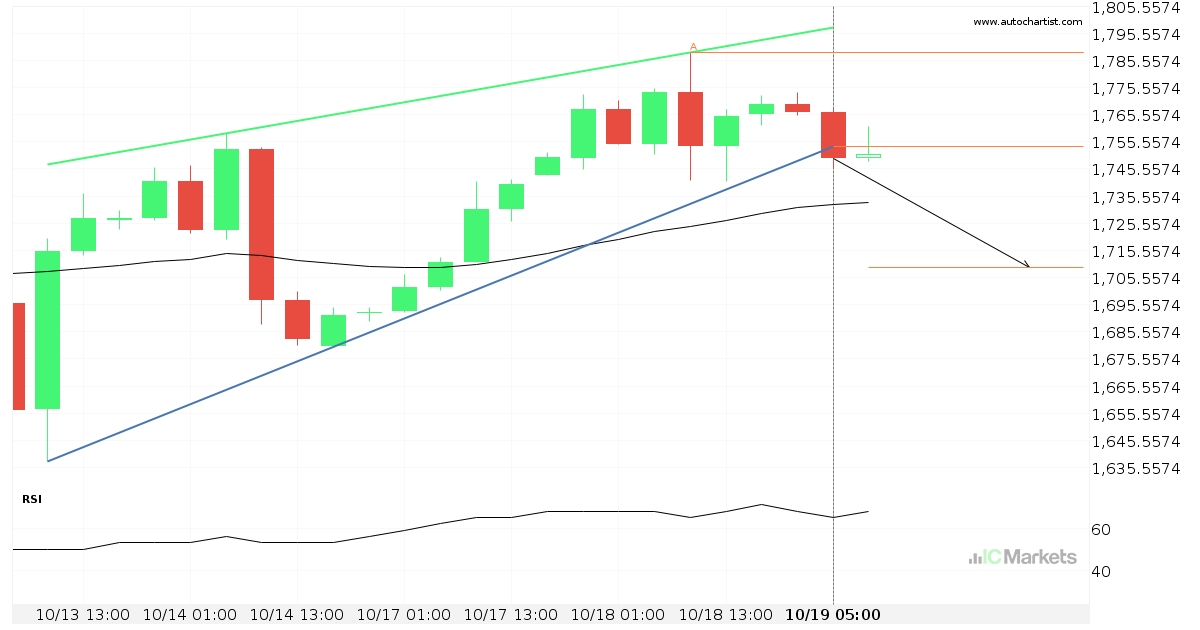
Support line breached by US Small Cap 2000 Index

US Small Cap 2000 Index has broken through the support line which it has tested twice in the past. We have seen it retrace from this line before, so one should wait for confirmation of the breakout before trading. If this new trend persists, a target level of around 1709.2306 may materialize within the next […]

Read more
October 18, 2022North_American_Stocks_enIC Markets

Possible breach of resistance level by US Small Cap 2000 Index

US Small Cap 2000 Index is moving towards a resistance line which it has tested numerous times in the past. We have seen it retrace from this line before, so at this stage it isn’t clear whether it will breach this line or rebound as it did before. If US Small Cap 2000 Index continues […]

Read more
October 17, 2022North_American_Stocks_enIC Markets

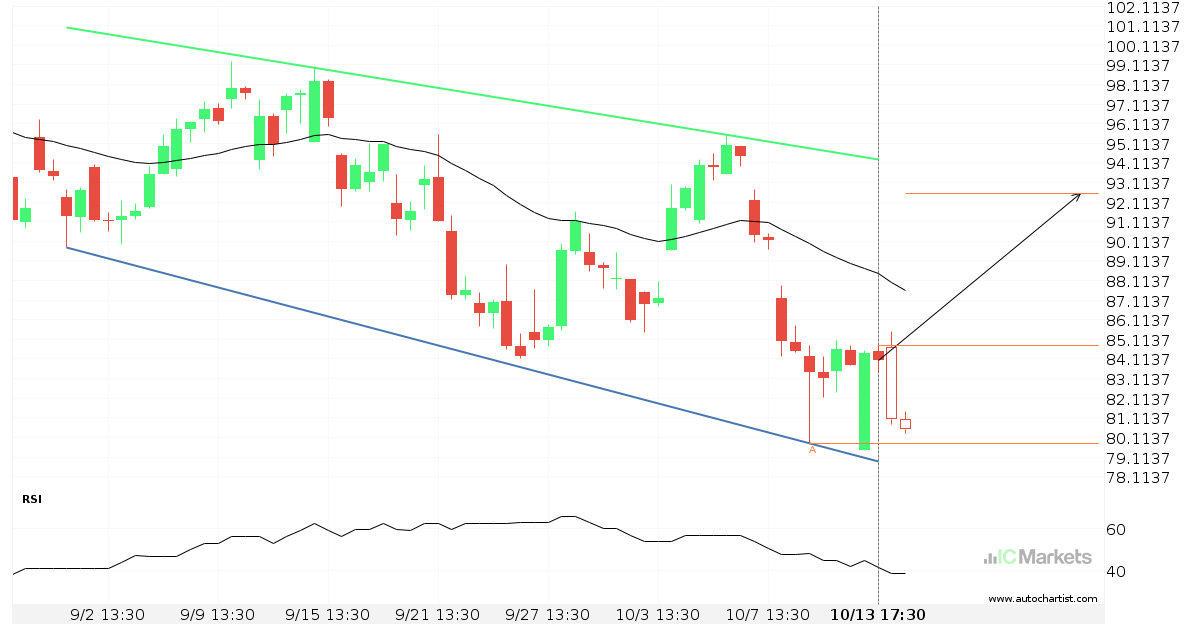
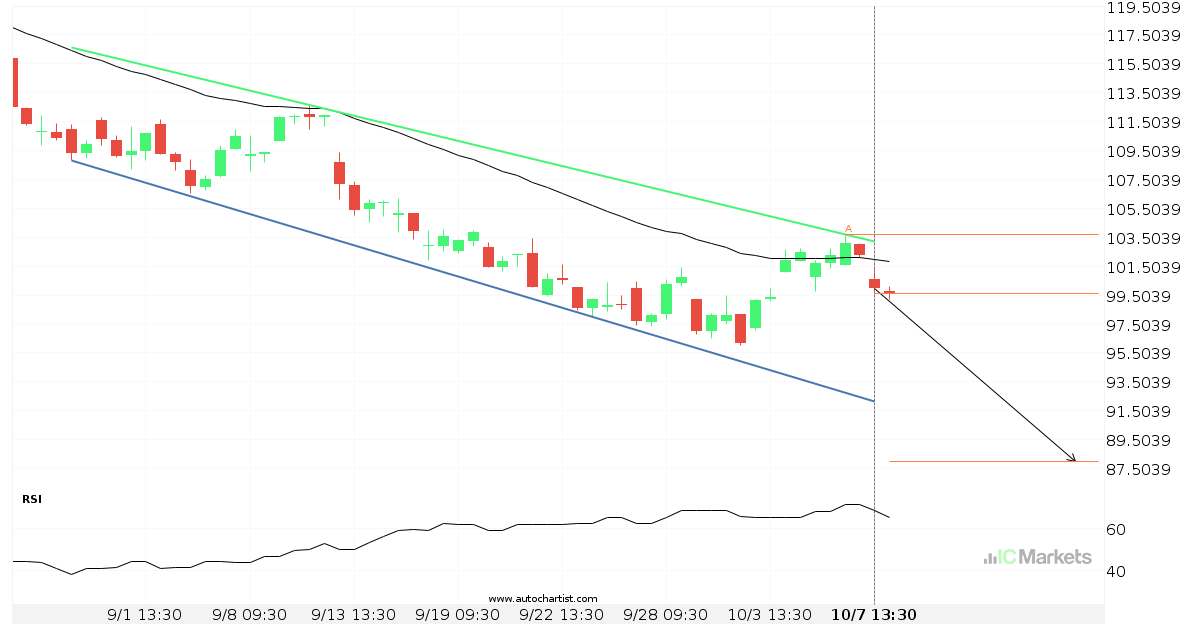
Paypal Holdings Corp approaching resistance of a Channel Down

Paypal Holdings Corp is approaching the resistance line of a Channel Down. It has touched this line numerous times in the last 43 days. If it tests this line again, it should do so in the next 3 days.

Read more
October 14, 2022North_American_Stocks_enIC Markets

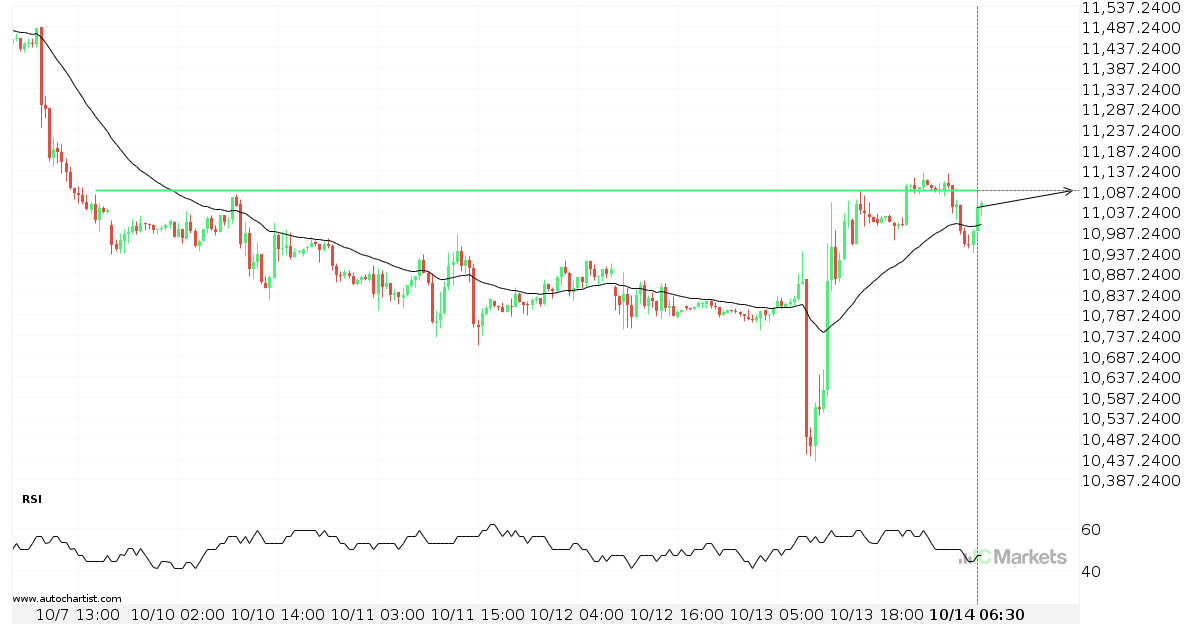
Breach of important price line imminent by US Tech 100 Index

US Tech 100 Index is moving towards a line of 11090.5000 which it has tested numerous times in the past. We have seen it retrace from this position in the past, so at this stage it isn’t clear whether it will breach this price or rebound as it did before. If US Tech 100 Index […]

Read more
October 12, 2022North_American_Stocks_enIC Markets

US Wall Street 30 Index approaching resistance of a Rising Wedge

US Wall Street 30 Index is approaching the resistance line of a Rising Wedge. It has touched this line numerous times in the last 2 days. If it tests this line again, it should do so in the next 11 hours.

Read more
October 11, 2022North_American_Stocks_enIC Markets

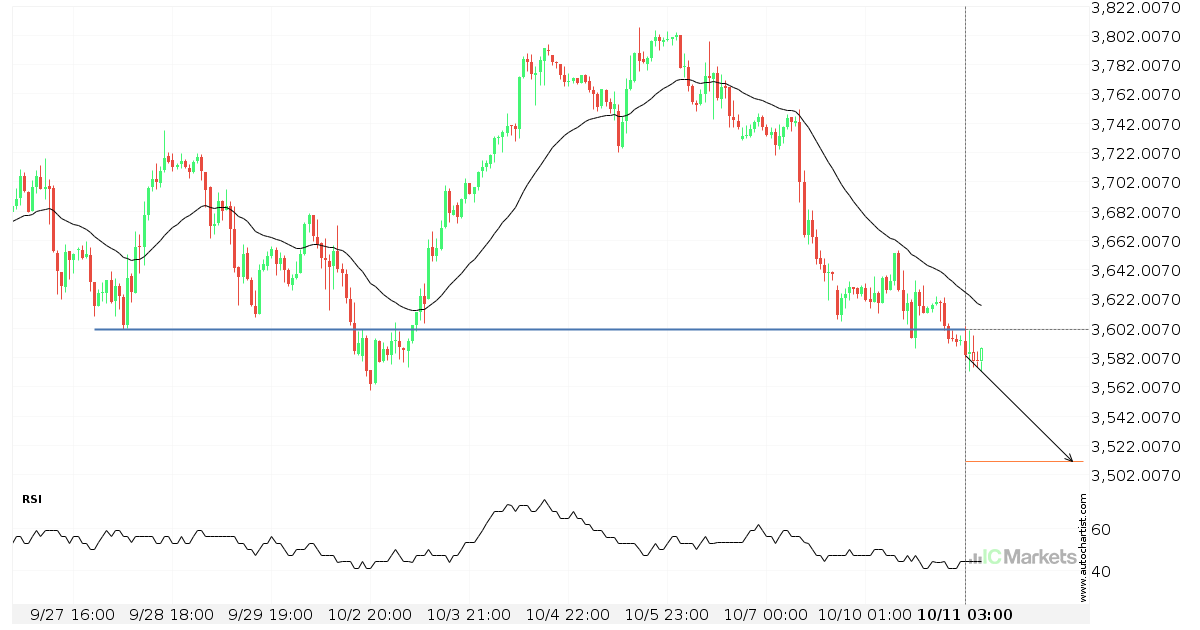
Important price line breached by US SPX 500 Index

US SPX 500 Index has broken through 3600.8000 which it has tested numerous times in the past. We have seen it retrace from this price in the past. If this new trend persists, US SPX 500 Index may be heading towards 3511.0601 within the next 3 days.

Read more
October 10, 2022North_American_Stocks_enIC Markets

Either a rebound or a breakout imminent on ALPHABET INC CLASS C

ALPHABET INC CLASS C is heading towards the support line of a Channel Down. If this movement continues, the price of ALPHABET INC CLASS C could test 88.0100 within the next 3 days. It has tested this line numerous times in the past, so this movement could be short-lived and end up rebounding just like […]

Read more
October 7, 2022North_American_Stocks_enIC Markets

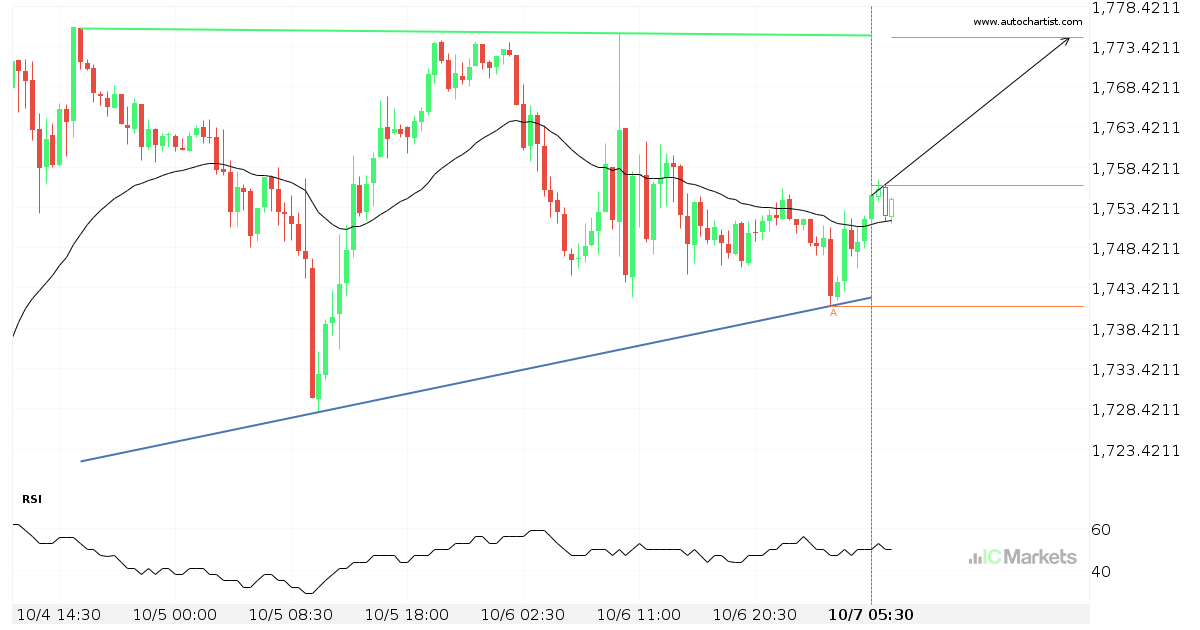
US Small Cap 2000 Index approaching resistance of a Ascending Triangle

US Small Cap 2000 Index is approaching the resistance line of a Ascending Triangle. It has touched this line numerous times in the last 3 days. If it tests this line again, it should do so in the next 17 hours.

Read more
October 6, 2022North_American_Stocks_enIC Markets

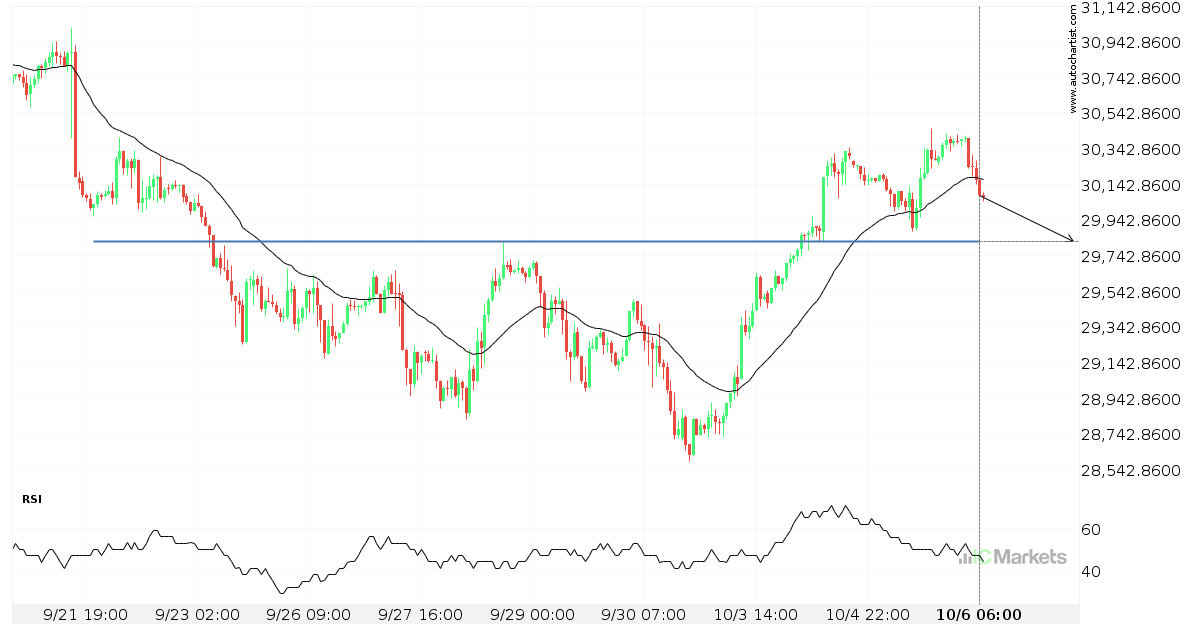
A final push possible on US Wall Street 30 Index

US Wall Street 30 Index is heading towards 29820.1992 and could reach this point within the next 3 days. It has tested this line numerous times in the past, and this time could be no different, ending in a rebound instead of a breakout. If the breakout doesn’t happen, we could see a retracement back […]

Read more
October 5, 2022North_American_Stocks_enIC Markets

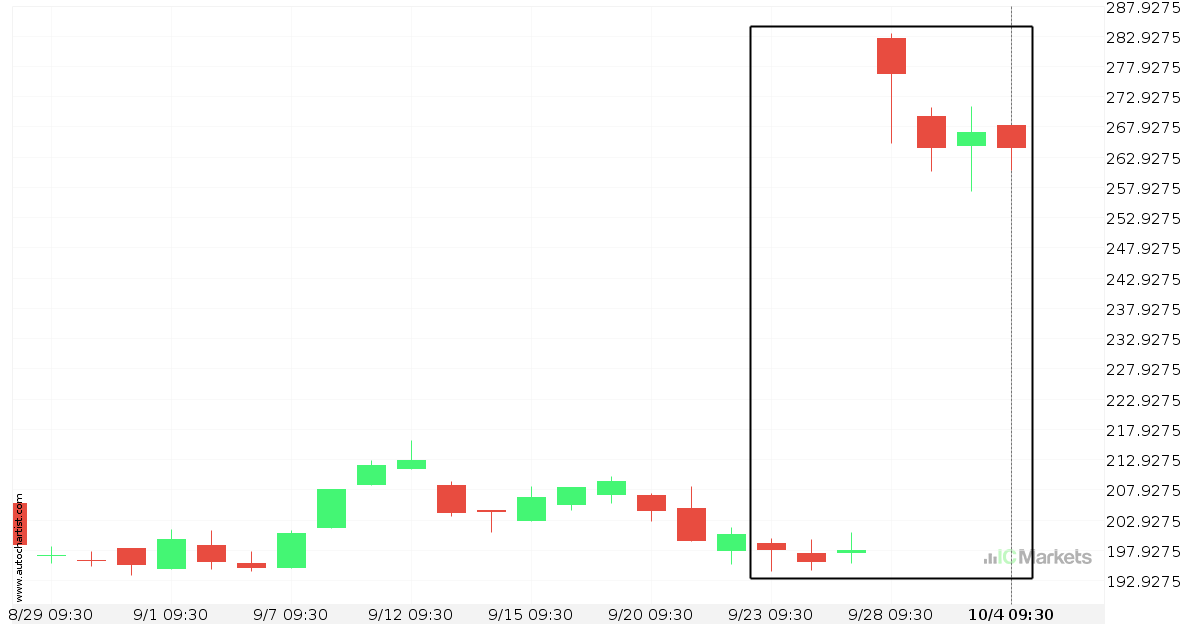
Huge bullish move on Biogen Idec Inc

Biogen Idec Inc has moved higher by 33.6% from 199.1 to 264.32 in the last 12 days.

Read more
  • 1
  • 2
  • 3
  • 4
  • 5
  • 6
  • 7
  • …
  • 45
  • 46
  • 47

Recent Posts

  • Either a rebound or a breakout imminent on SILVER
  • GOLD Nível visado: 2976.3601
  • A potential bearish movement on GOLD
  • มีโอกาสเกิดการเคลื่อนตัวแบบ bearish บน GOLD
  • Posible gran movimiento en el AUDJPY

Recent Comments

    Translation


     Edit Translation

    เปิดบัญชีและฝากเงินได้แบบทันที

    เทรดได้ภายในไม่กี่นาที!

    เริ่มต้น ลองบัญชีเดโมได้ฟรี

    การเทรดฟอเร็กซ์

    • ภาพรวมของบัญชี
    • เปิดบัญชี
    • ใช้งาน Web Trader

    รายละเอียดของการซื้อขาย

    • สเปรดและค่าคอมมิชชั่น
    • ขอบเขตของตลาด
    • ช่วงเวลาซื้อขาย
    • การเพิ่มเงิน
    • การถอนเงิน

    เกี่ยวกับ IC Markets

    • Help Centre
    • ทำไมถึงต้องเป็น IC Markets
    • กฎระเบียบ
    • เอกสารทางกฎหมาย
    • ติดต่อเรา


    Forex Trading

    • Accounts Overview
    • Open an Account
    • Launch Web Trader

    Trading Specifications

    • Spreads and Commissions
    • Range of Market
    • Trading Hours
    • Funding
    • Withdrawal

    About IC Markets

    • Chat with a Specialist 24/7
    • Why IC Markets
    • Regulation
    • Legal Documents
    • ติดต่อเรา

    ข้อความจำกัดความรับผิดชอบ: เนื้อหาข้อมูลนี้เป็นเนื้อหาด้านการตลาดซึ่งได้ถูกเผยแพร่เพื่อวัตถุประสงค์ในการให้ข้อมูลเท่านั้น เนื้อหานี้ไม่ได้ประกอบไปด้วยและไม่ควรถือว่าประกอบไปด้วยคำแนะนำหรือการเสนอแนะด้านการลงทุน หรือการแนะนำให้มีการดำเนินการใดๆ กับตราสารทางการเงิน วิดเจ็ตที่แสดงอยู่ภายในเป็นของผู้จัดทำจากภายนอกและ IC Markets ไม่มีส่วนรับผิดชอบใดๆ เกี่ยวกับเนื้อหาและผลกระทบที่มีต่อการเทรด

    สงวนลิขสิทธิ์สำหรับเนื้อหาทั้งหมด ความคิดเห็นของผู้จัดทำอาจไม่สอดคล้องกับความคิดเห็นของผู้จัดทำบล็อก เมื่อมีการคัดลอกเนื้อหาจากเว็บไซต์นี้หรือมีการเชื่อมโยงไปยังฟีด RSS เพื่อเผยแพร่บทความของเรา ผู้ที่ทำการคัดลอกจะต้องใส่ลิงก์ไปยัง IC Markets หรือมีการระบุแหล่งที่มาในรูปแบบ ‘IC Markets Blog’ สำหรับคำถามโดยทั่วไปโปรดติดต่อสำนักงานบรรณาธิการผ่านทางแบบฟอร์มบนหน้าติดต่อเรา

    คำเตือนเกี่ยวกับความเสี่ยง: การเทรดตราสารอนุพันธ์มีความเสี่ยงในระดับสูงกับเงินทุนของคุณและคุณควรทำการเทรดด้วยเงินที่คุณ สามารถรับการขาดทุนได้เท่านั้น การเทรดตราสารอนุพันธ์อาจไม่เหมาะกับนักลงทุนทุกท่าน ดังนั้นโปรดทำความเข้าใจกับความเสี่ยงที่เกี่ยวข้องและหาคำแนะนำที่เป็นอิสระหากจำเป็น นักลงทุนควรศึกษา Product Disclosure Statement (PDS) ก่อนทำธุรกรรมใดๆ กับเรา

    เนื้อหาข้อมูลที่ถูกแสดงอยู่บนหน้านี้เป็นข้อมูลโดยทั่วไปเท่านั้นและไม่ได้มีการคำนึงถึงสถานการณ์ส่วน ตัวของคุณ, เป้าหมายทางการเงิน หรือความต้องการของคุณ คุณเป็นผู้พิจารณาว่าผลิตภัณฑ์ต่างๆ ที่เรามีให้บริการเหล่านี้ตรงกับความต้องการของคุณหรือไม่ อีกทั้งคุณไม่ควรทำการเทรดกับเราจนกว่าคุณจะเข้าใจถึงคุณสมบัติและความเสี่ยงที่เกี่ยวข้องกับผลิตภั ณฑ์ที่เรามีให้บริการ นั่นหมายความว่าคุณอาจต้องการคำแนะนำที่เป็นอิสระก่อนที่คุณจะเริ่มต้นเทรดกับเรา

    © 2022 Raw Trading Ltd | All rights reserved.
    • Sample Page